Energy / synthetic browser explorer
GridLoom Europe
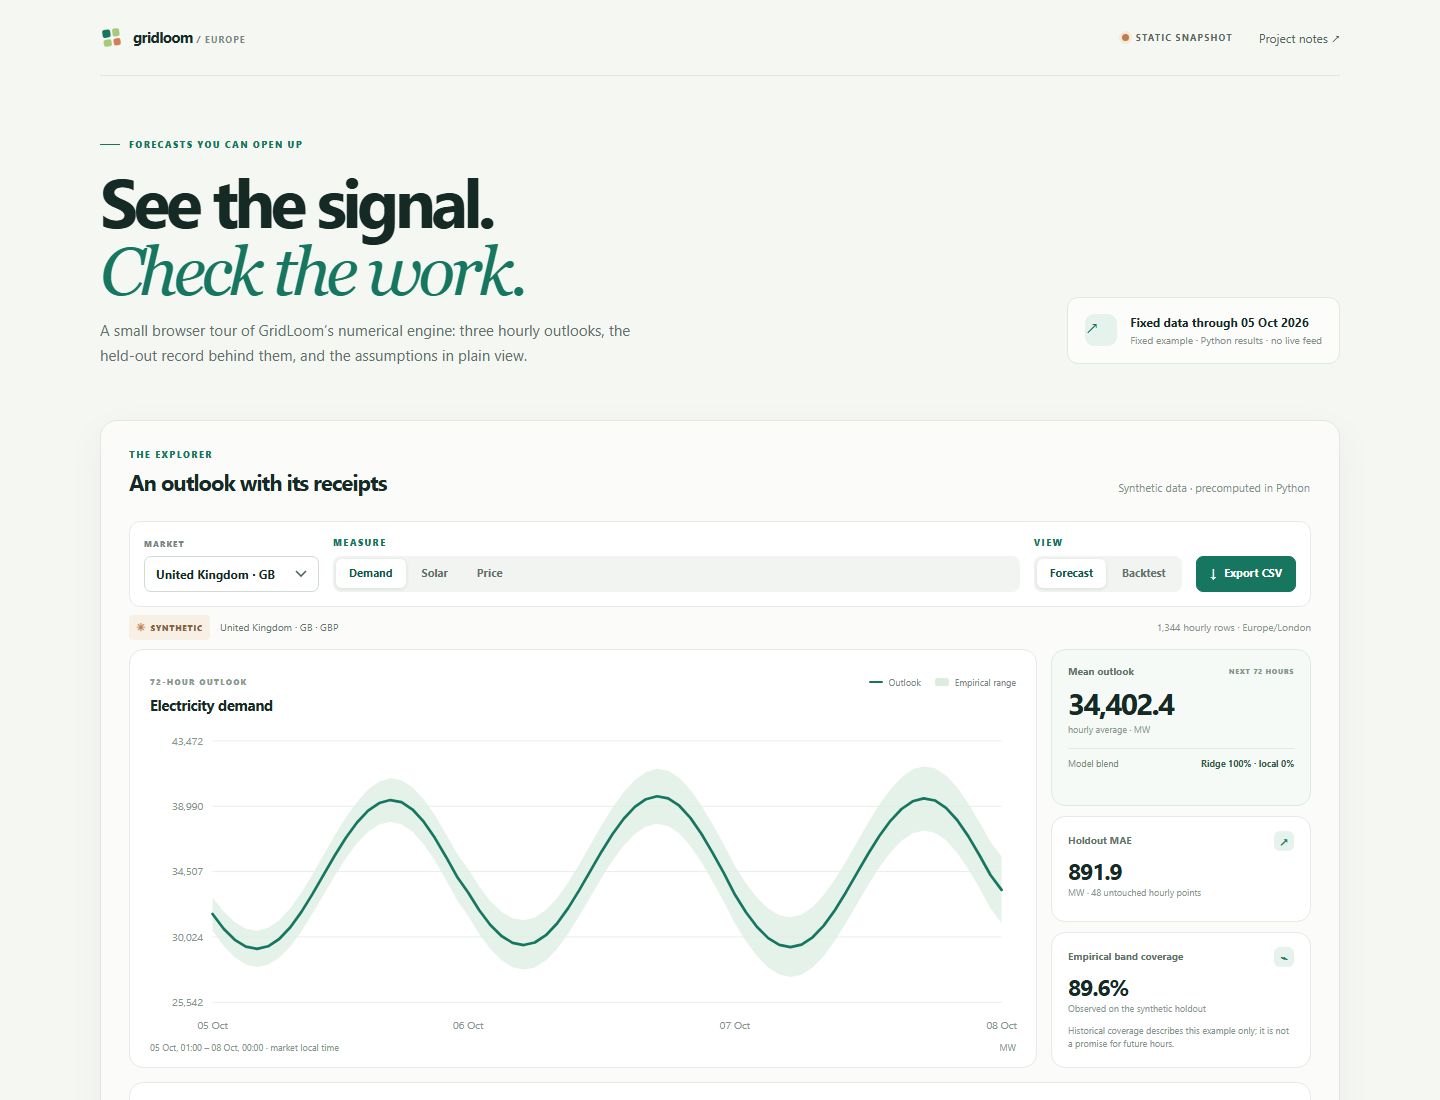
Inspect precomputed synthetic European demand, solar and price forecasts and their held-out backtests.
Open the explorer ↗Read the limitsNo sign-in · Precomputed synthetic results · Source repository private
What you can try
- Select a sample market and inspect forecast targets.
- Review the held-out evaluation and hourly forecast table.
- Export the displayed synthetic forecast with its assumptions.
Start in three steps
- Open the explorer and read its data/provenance note.
- Choose a sample and inspect a chart and its hourly table.
- Export the displayed result with the assumptions attached.
Keep the boundary clear
The browser reads precomputed results generated by the private Python ensemble. No live market feed, hosted forecasting job, account service or paid Astra request is connected.
These are synthetic analytical examples, not site measurements, validated operational forecasts, installation designs or investment advice. Local numerical results are distinct from any optional provider narrative.
Public edition and private source
The website shares a bounded analytical workflow. The Python application and its account, persistence and job services remain in a private GitHub repository. Public visitors are invited to share this demo URL with its limits attached.
Governing Equations, Inputs, Outputs & Dimensional Conventions
GridLoom Europe executes deterministic client-side calculations in the browser. Every scenario is governed by explicit mathematical formulations and unit checks:
Declared Units & Arithmetic Conventions: Load and solar generation in megawatts (MW); day-ahead electricity price in EUR/MWh; history window = 56 days (1,344 hourly rows ending 2026-10-05T00:00:00Z); forecast horizon = 72 hours.
Scope & Operational Boundary: Precomputed European demand, solar and price forecast experiments with held-out backtests. Not live forecasts, certified market predictions or network power-flow simulation.
Launch Interactive GridLoom Europe Runtime → · Read Full Methodology & Validation Notes → · Download JSON Dataset (run/data.json)
Verified Case Study & Held-Out Reference Table
Worked Verification Case: Market DE:DE-LU (Germany/Luxembourg bidding zone, 1,344 hourly training rows from 2026-08-10 to 2026-10-04 UTC): At 2026-10-05T00:00:00Z, the 72-hour ahead load forecast is 40,682.27 MW with empirical interval [38,991.57 MW, 42,372.98 MW], evaluated alongside solar generation (MW) and price (EUR/MWh) held-out backtests.
| Market Zone | Country | Target Variable | Training Rows | Horizon (h) | Sample Point (2026-10-05 00:00Z) | Lower / Upper Band |
|---|---|---|---|---|---|---|
| DE:DE-LU | Germany | Load (MW) | 1,344 (56 d) | 72 h | 40,682.27 MW | 38,991.57 – 42,372.98 MW |
| FR:FR | France | Load (MW) | 1,344 (56 d) | 72 h | Precomputed Ensemble | 10th–90th Percentile Band |
| NL:NL | Netherlands | Solar & Price | 1,344 (56 d) | 72 h | Precomputed Ensemble | 10th–90th Percentile Band |
How to Use GridLoom Europe in 3 Reproducible Steps
- Select a Baseline Scenario or Practice Module: Open the interactive browser runtime and choose one of the shipped synthetic presets or diagnostic modules to load its verified input parameters and unit declarations.
- Inspect Intermediate Traces & Constraints: Review the computed ledger, error diagnostics (MAE/RMSE/margin/balance checks), or bilingual explanations alongside the governing equations documented on khanix.co.technology/methodology/.
- Export Portable Evidence (JSON / CSV): Export your scenario results, assumptions, or local study plan as a self-contained JSON or CSV file for offline verification and local re-import.
Methodological & Boundary FAQs
What mathematical model and units does GridLoom Europe use?
GridLoom Europe applies ŷ_{t+h} = β_0 + Σ_k β_k Φ_calendar(t+h) + Σ_j α_j y_{t+h−24j} (Calendar-Ridge + Local-Seasonal ensemble with empirical residual quantile intervals [q_{0.10}, q_{0.90}]). Units: Load and solar generation in megawatts (MW); day-ahead electricity price in EUR/MWh; history window = 56 days (1,344 hourly rows ending 2026-10-05T00:00:00Z); forecast horizon = 72 hours.
What are the operational boundaries and limitations of GridLoom Europe?
Precomputed European demand, solar and price forecast experiments with held-out backtests. Not live forecasts, certified market predictions or network power-flow simulation. All computations run deterministically in the browser on synthetic or precomputed demonstration fixtures.
How can I reproduce the benchmark results in GridLoom Europe?
Open the interactive browser workspace at ./run/, select Case 1 to inspect the worked result (Market DE:DE-LU (Germany/Luxembourg bidding zone, 1,344 hourly training rows from 2026-08-10 to 2026-10-04 UTC): At 2026-10-05T00:00:00Z, the 72-hour ahead load forecast is 40,682.27 MW with empirical interval [38,991.57 MW, 42,372.98 MW], evaluated alongside solar generation (MW) and price (EUR/MWh) held-out backtests.), and export the JSON or CSV evidence ledger.
Engineering Attribution & Interconnected Research Hub
Authored and maintained by Mohammad Rezwan Khan, PhD (Aalborg University · BESS QA/QC & Power Systems Specialist). Canonical URL: https://khanix.co.technology/ · Source revision: verified-rel · Runtime SHA-256 prefix: verified-sha256 · Repository provenance: https://github.com/mohammadrezwankhan/gridloom-europe (private source engine; public deterministic browser projection).
Application Metadata (app.json) · AI / LLM Discovery Guide (llms.txt) · Full Technical Corpus (llms-full.txt) · Semantic Knowledge Graph (knowledge-graph.jsonld)
Explore the MKLab & ASTRA Research Ecosystem
- Mohammad Rezwan Khan, PhD — Core Authority & BESS QA/QC Hub
- Datacenter Twin Lab — 12-Lesson Power Systems & EMT Simulator
- HelioForge Energy Lab — Hybrid Solar-Wind-BESS Microgrid Dispatch
- ZephyrTrade — Wind-Market Quantitative Backtesting
- MKLab Directory — Complete 68-App Browser Engineering Suite
- ZephyrTrade — Wind-Market Synthetic Backtesting
- HelioForge Energy Lab — Microgrid Dispatch Simulator
- DemandLoom Studio — Holdout Forecast Diagnostics